Kikidata
DATA VISUALIZATION
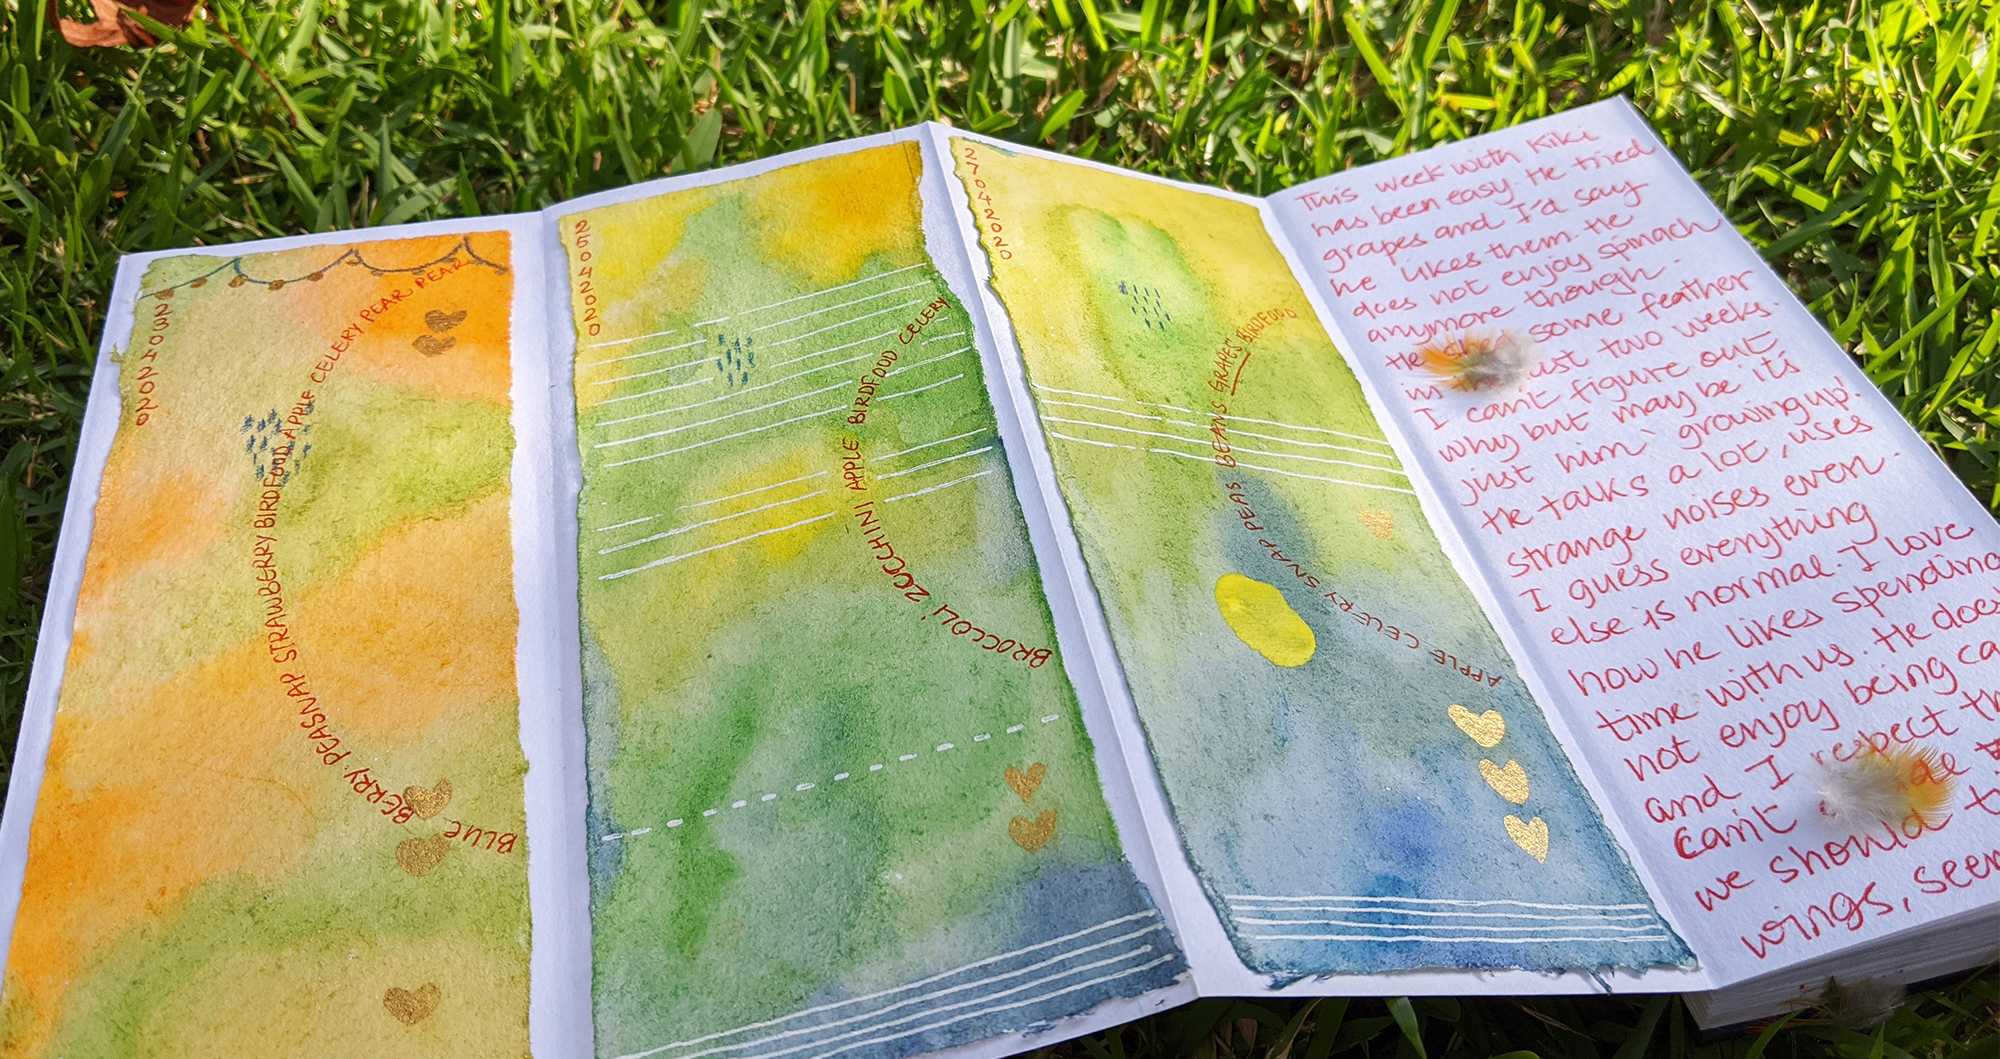
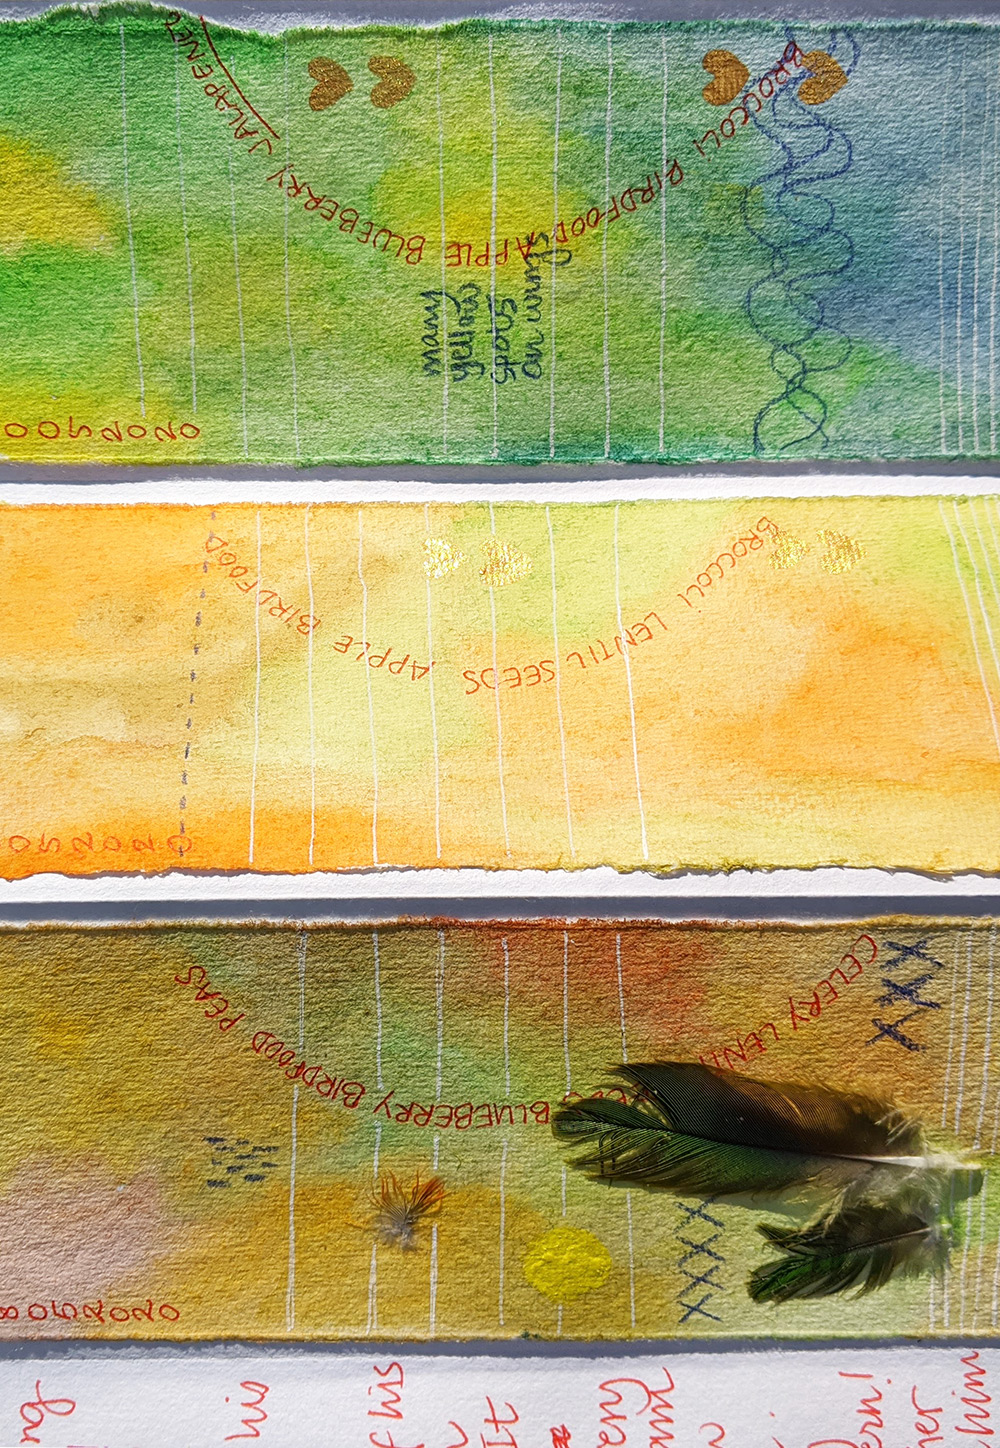
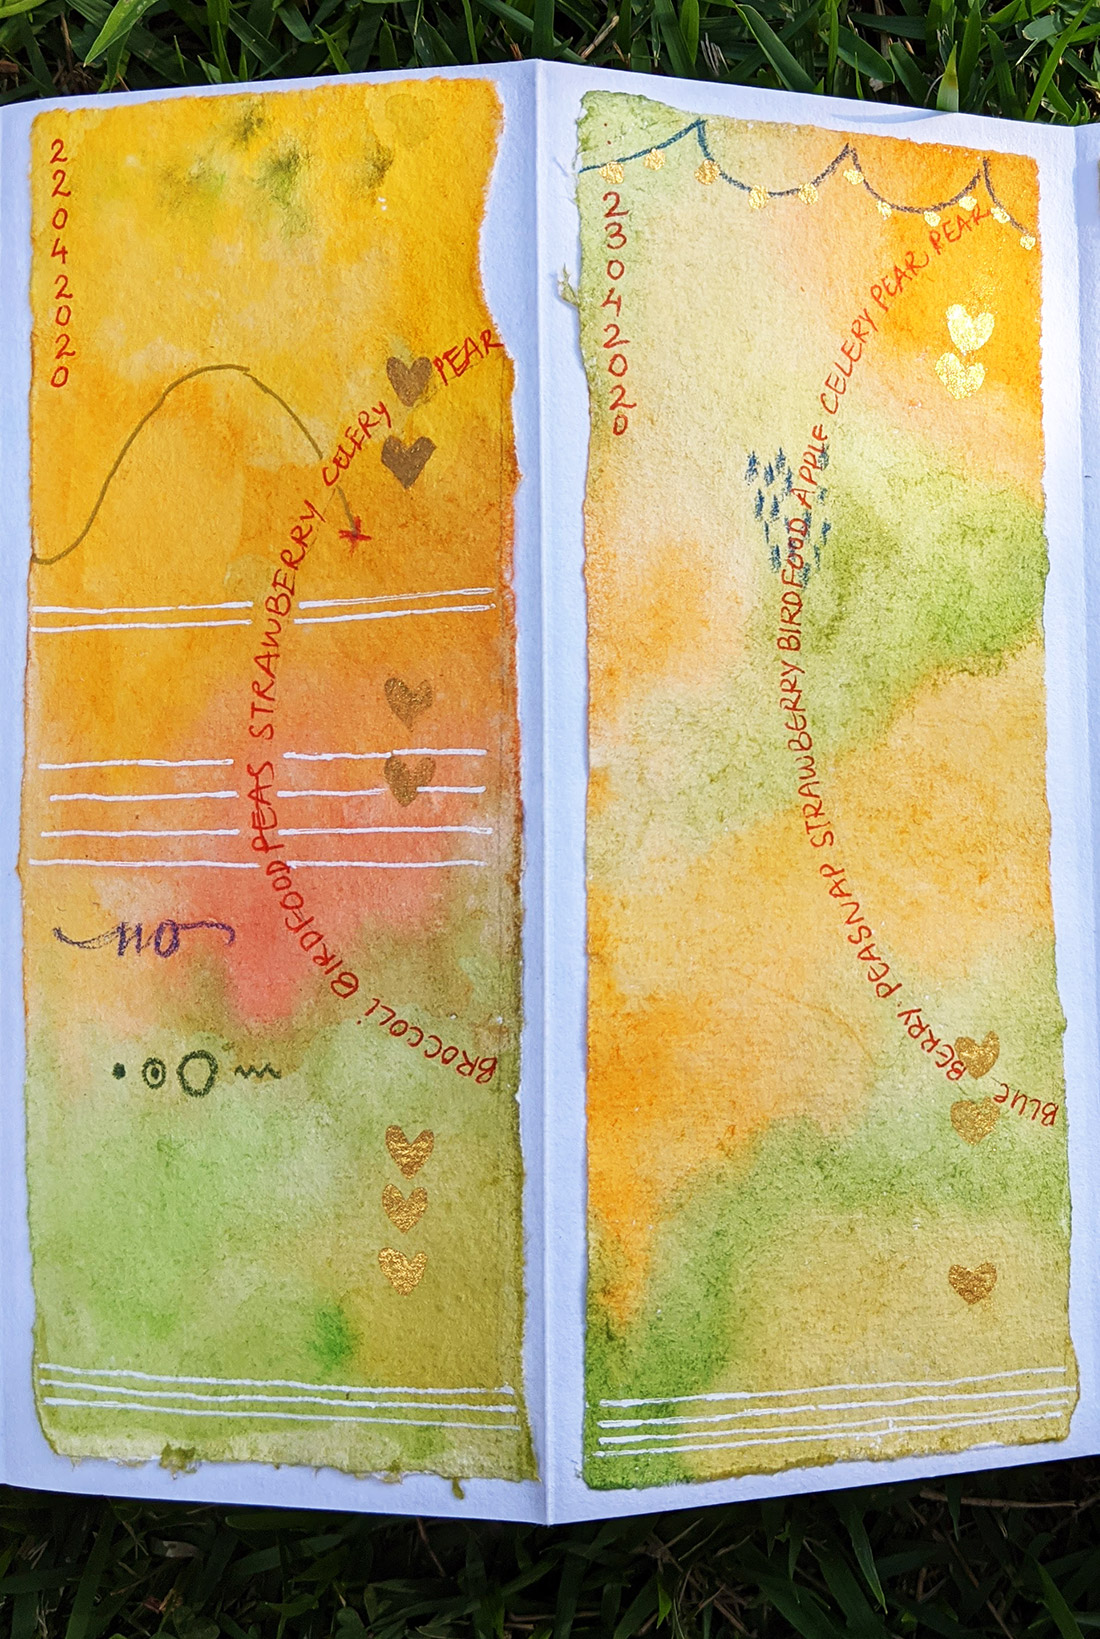
Kikidata is a data visualization weekly-journal of my first pet, a sun conure, Kiki. From the day I got him, I started documenting his routine. This included about everything from food, sleep, him learning to fly, his baths and where he bit me. The most important was documenting the transformation of the colors of his feathers. I chose this particular size so it matched Kiki.
This journal lasted for 10 weeks.
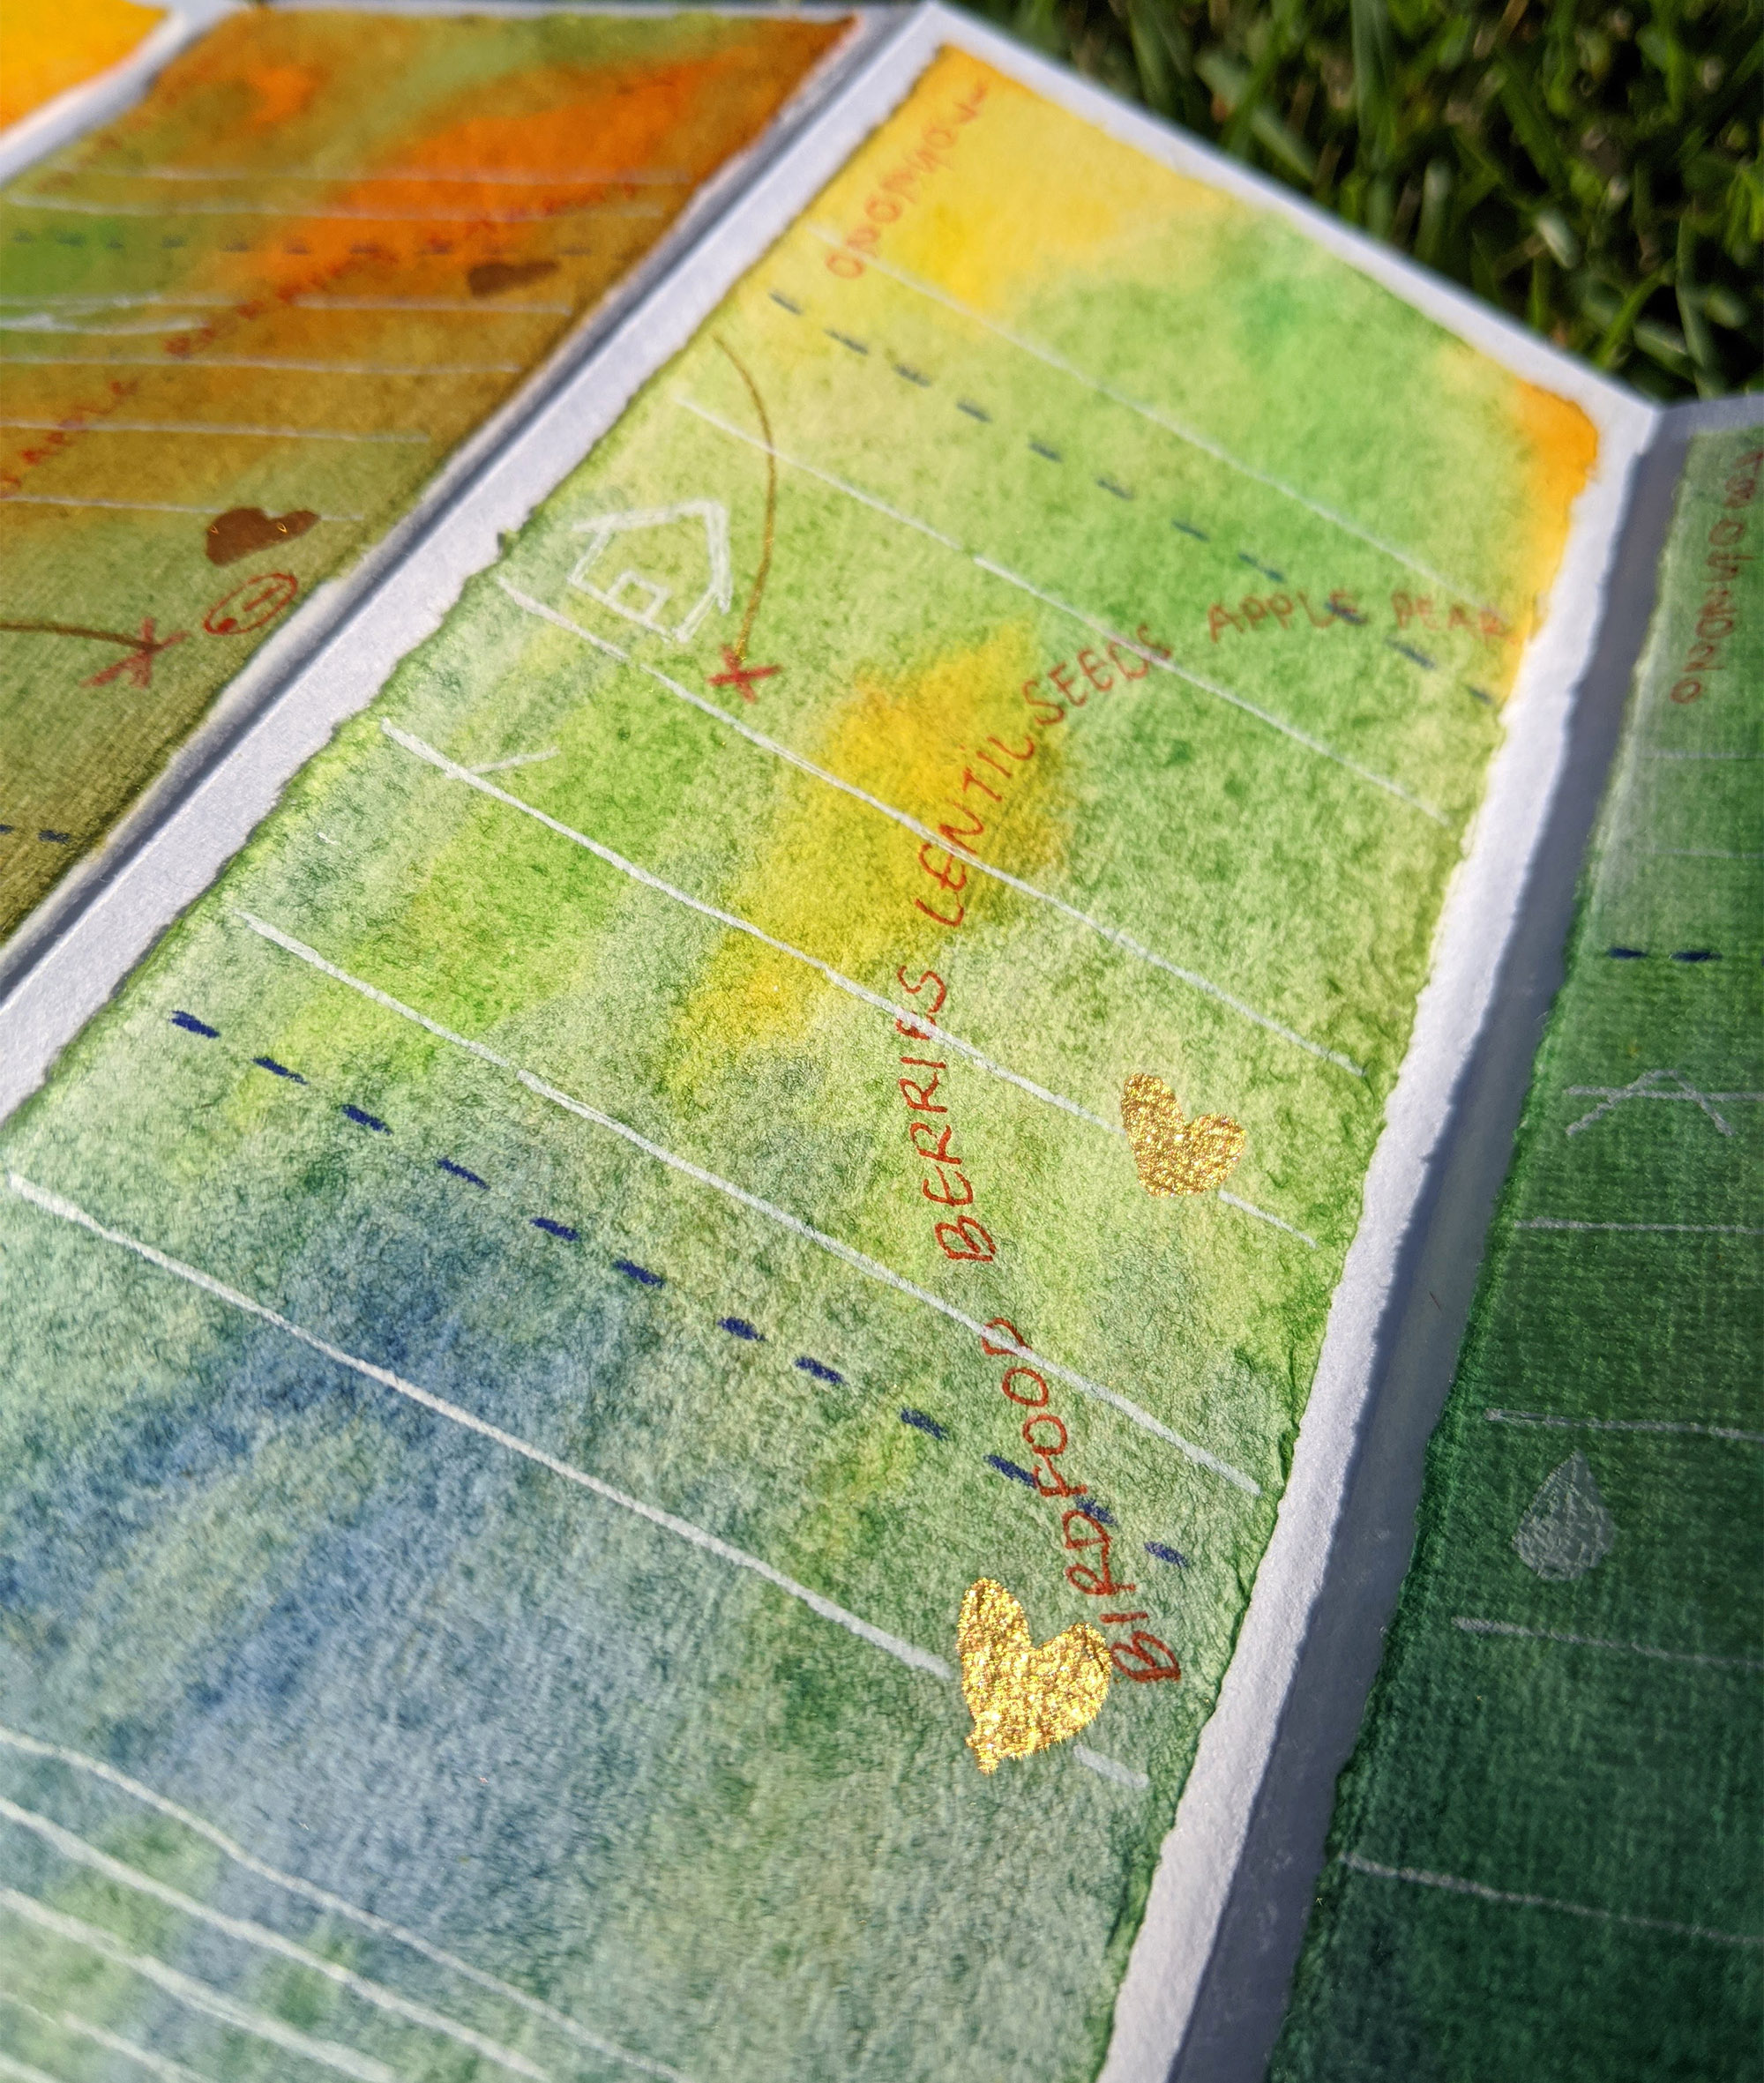


Each week was 5 pages long, the colours of the first four pages were to capture the transformation of Kiki’s appearance. The first page is Kiki’s head, second his back, third his stomach and fourth his tail.
The last page was a general summary of the observations around the week.
my kiki